
List of Content
Global Enterprise Carbon Management Software Market 2026 – 2035
Enterprise Carbon Management Software Market Size, Trends and Insights By Component (Software, Carbon Accounting Software, Emissions Tracking Software, Reporting and Analytics Software, Services, Professional Services, Managed Services), By Deployment Mode (Cloud-based, On-premise, Hybrid), By Organization Size (Small and Medium Enterprises (SMEs), Large Enterprises), By Application (Carbon Accounting and Reporting, Emissions Tracking and Monitoring, Sustainability Reporting, Supply Chain Carbon Management, Carbon Offsetting and Trading, Other Applications), By End-User Industry (Manufacturing, Energy and Utilities, Transportation and Logistics, Retail and Consumer Goods, Information Technology, Financial Services, Other Industries), and By Region - Global Industry Overview, Statistical Data, Competitive Analysis, Share, Outlook, and Forecast 2026 – 2035
Report Snapshot
| Study Period: | 2026-2035 |
| Fastest Growing Market: | Asia-Pacific |
| Largest Market: | North America |
Major Players
- Workiva Inc.
- Wolters Kluwer (Enablon)
- Sphera Solutions Inc.
- ENGIE Impact
- Others
Reports Description
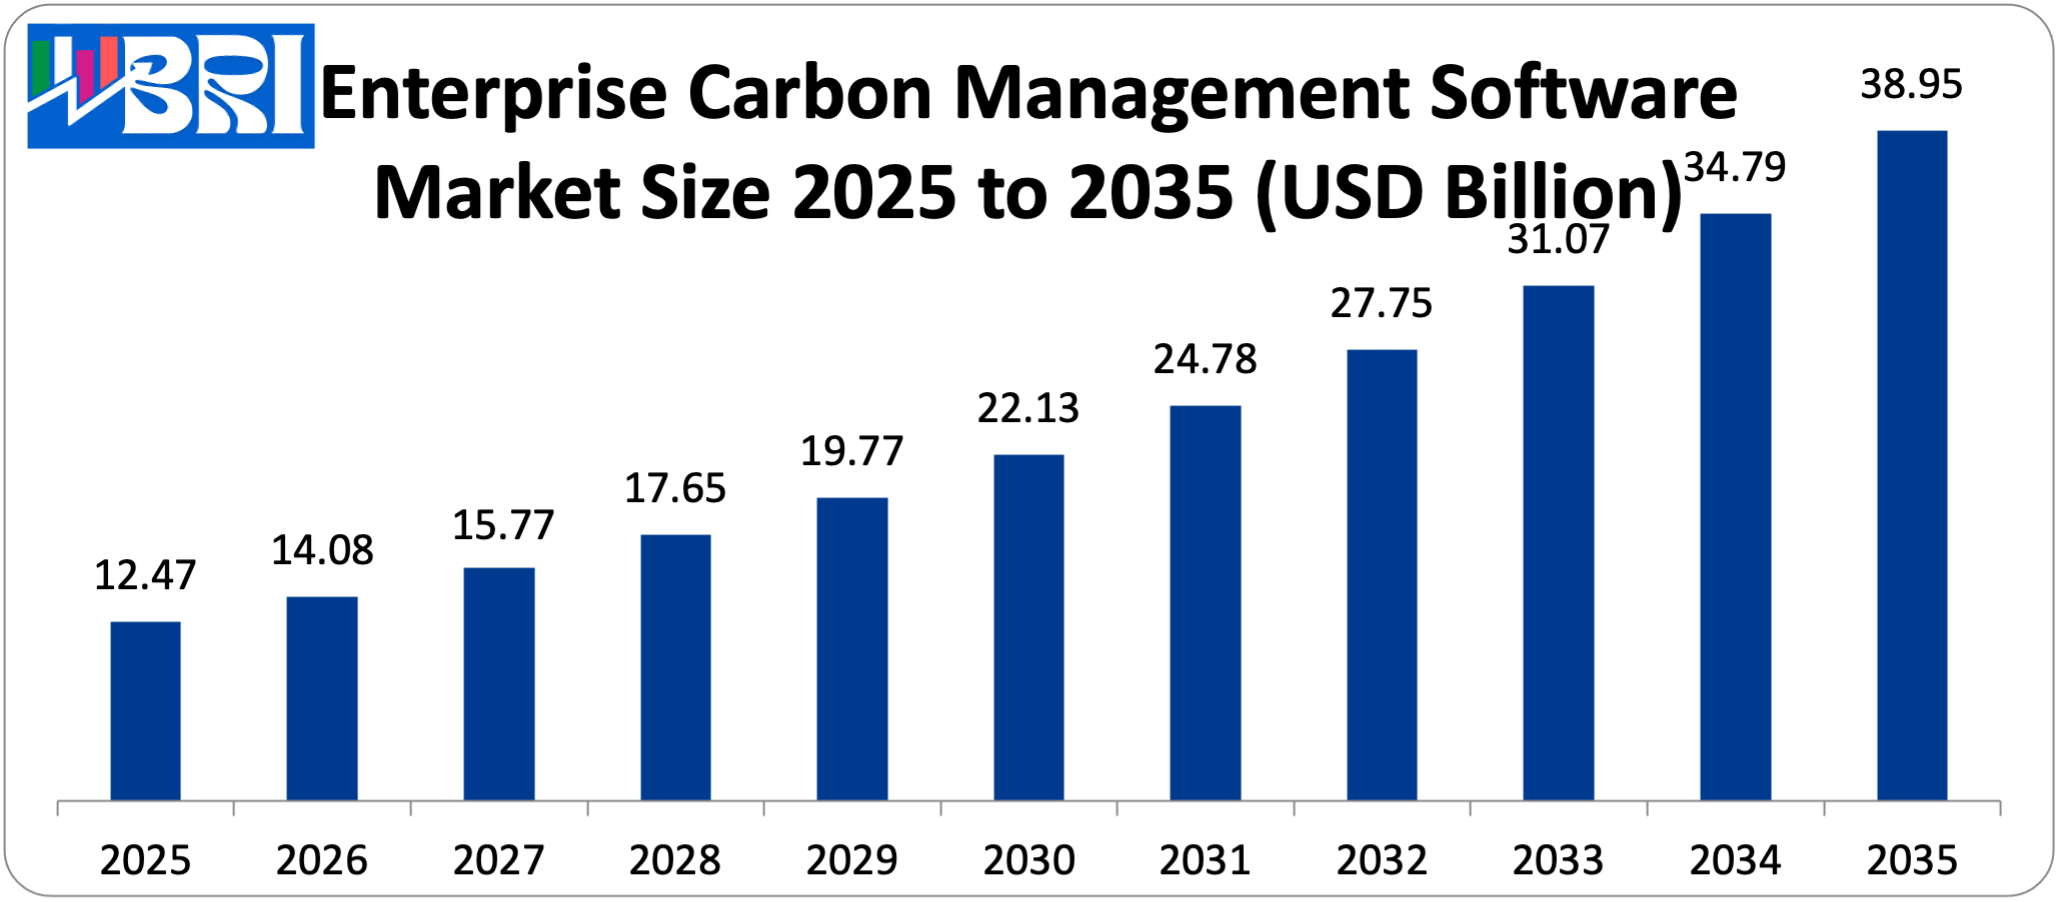
The worldwide enterprise carbon management software market is estimated at USD 12.47 billion in the year 2025 and is simulated to rise between USD 14.08 billion in the year 2026 to estimated USD 38.95 billion between the year 2026 and 2035 at a CAGR of 12.9%. The pressure of carbon emissions disclosure, the development of corporate obligations to net-zero solutions, the emergence of the increased demand of investors and stakeholders to receive information about ESG development, the development of AI and IoT technologies used in monitoring emissions, and the global impulse to decarbonize encourage the development of the market.
Market Highlight
- Europe, a leader in the enterprise carbon management software market, has a market share of 41% in 2025.
- The fastest CAGR of the region is anticipated to be 15.2% in Asia Pacific within the period of 2026-2035.
- By segment, the software segment was estimated to have 63% of the market share in 2025.
- By deployment mode, the cloud-based segment is increasing at the highest CAGR of 13.8% between 2026 and 2035.
- As per end-user industry, the manufacturing segment will have the largest market share of 28% in 2025.
- By size of organization, large ventures in 2025 took up 71% of the market share.
Significant Growth Factors
The Enterprise Carbon Management Software Market Trends present significant growth opportunities due to several factors:
- Stringent Regulatory Mandates and Compliance Requirements: The growing introduction of compulsory carbon disclosure policies and other climate financial reporting policies is the main motivation factor of the enterprise carbon management software market, whereby government and regulators worldwide are creating an in-depth framework, involving extensive requirements of emissions tracking, reporting and reduction planning. Based on the statistics of the global climate policy analysis in 2025, more than 70 countries comprising 76% of the world GDP have developed or declared the carbon pricing mechanisms, carbon tax, or emissions trading systems that need precise quantification and reporting. Enterprise carbon management software offers central data collection and storage of emissions, automated algorithms to calculate emissions that are in line with GHG Protocol standards, audit trails of data integrity and compliance, and standardized reporting provisions of multiple regulatory frameworks at the same time. Sophisticated platforms encompass jurisdiction-calculated methodologies of grid emission factors, compliance rule engines of evolving regulations across various markets, and automated report generation of disclosures in TCFD (Task Force on Climate-related Financial Disclosures), CDP, GRI (Global Reporting Initiative), and other systems. Compliance research found the companies that employ specialized carbon management software save an average of 60-75% of the reporting time against the same methods of using manual spreadsheets and improve the data accuracy and audit preparedness, a strong business case exists as to platforms adoption despite the complexity of the regulations.
- Corporate Net-Zero Commitments and Climate Targets Driving Strategic Importance: Corporate Net-Zero ambitions and Climate Targets as a source of Strategic Significance: The market development has increased significantly because of voluntary corporate goals to reach net-zero emissions, carbon neutrality, or science-based reduction targets, and carbon management is no longer part of the compliance responsibility, but a strategic business necessity that needs complex measurement and management systems. The Science-Based Targets initiative (SBTi) documents that more than 9,000 enterprises worldwide have undertaken the goal of establishing a target of reducing emissions to lower global warming to 1.5C above pre-industrial temperature, with 4,000-plus having ratified science-based targets that mandate intense monitoring and reduction development plans of the companies. Large companies such as Microsoft, Apple, Amazon, and Unilever have put in place ambitious climate goals demanding organizational and supply chain changes, which indicate carbon management is now board-level strategy instead of the environmental department. The current platforms include carbon accounting which is intertwined with financial models that render carbon cost-visibility, supplier engagement portal allowing collection of supply chain emissions data, and capital planning platforms that assess the investment in decarbonization projects. The corporate sustainability research studies show that formal carbon reduction programs result in 3.5% of the annual improvement of emissions intensity per company, unlike 1.2% in companies that did not implement structured programs, and software platforms are important facilitator of systematic reduction programs by means of data-driven decision making and accountability mechanisms.
What are the Major Advances Changing the Enterprise Carbon Management Software Market Today
- AI-Powered Emissions Analytics and Predictive Modeling: the most radical technological innovation is the integration of artificial intelligence and machine learning into carbon management tools that will make it possible to automatically process data, discover anomalies, predictive analytics, and intelligent proposals that will significantly increase the accuracy and efficiency of emissions management programs. Carbon management systems based on AI currently have automated processing of utility bills, fuel receipts, travel records, and supplier records with the use of optical character recognition and natural language processing, algorithms to estimate emissions when primary data is unavailable, anomaly detection when unusual patterns of consumption or data quality problems need investigation, and predictive analytics forecasting future emissions based on business growth projections and planned activities. In line with the studies on implementation, AI-enhanced platforms enhance data completeness and accuracy 40-50% better than traditional manual processes with a reduction of 70-80% in manual data entry and processing time. AI-based systems include natural language query interfaces that allow business users to pose query questions such as what are our top 10 sources of emissions, or how much would using renewable energy help us reduce our footprint and get immediate analytical results without the need to have technical skills.
- Comprehensive Scope 3 Supply Chain Carbon Tracking: The creation of advanced supply chain carbon management solutions deals with the most problematic of corporate carbon accounting, which is the measurement and control of emissions of the value chain that usually are 70-90% of overall corporate footprints but have thousands of suppliers and complicated data collection. The current carbon management systems inside enterprises are now designed to have suppliers engagement portals where suppliers can directly supply data on their emissions, automated supplier estimated emissions based on spends, industry averages and hybrid models when no primary data is available, supplier score carding to rank supplier by carbon intensity to make procurement decisions and supply chain mapping to visualize the locations of the emissions hotspots in multi-tier supply networks. The segment of the cloud-based deployment is growing most rapidly with the CAGR of 13.8% because the cloud is vital to the supply chain collaboration that needs the secure communication of information with the external parties, the scalability of the data related to the emissions of thousands of suppliers, and constant changes in the factors of emission and calculation techniques. The major platforms are connected to procurement systems that automatically trigger emission calculations when a purchase takes place and supply chain management platforms are used to visualize the carbon footprint when sourcing decisions are being made and supplier relationship management systems are using carbon performance as a factor in supplier evaluation criteria.
- Integrated ESG and Sustainability Reporting Platforms: An increasing stakeholder expectation of comprehensive sustainability disclosure including carbon management, rather than single disclosure of carbon, has been met by the introduction of new comprehensive environmental, social, and governance (ESG) reporting platforms. Recent built-in ESG systems include carbon and greenhouse gas emission management as a core module, energy and resource consumption reporting including water, waste, and materials, social reporting, such as diversity, health and safety, and community impact, governance reporting, such as board composition, ethics, and compliance, and biodiversity and ecosystem impact reporting to disclose nature-related information. The ESG investment research notes that the sustainable investment assets have reached USD 30.3 trillion in the world in 2022, which is 36% of professionally managed assets, and investors have increasingly relied on ESG data in investment decisions, risk measurement, and interactions with portfolio companies. The trend to integrate is an acknowledgment that carbon emissions are one aspect of corporate environmental impact together with water usage, waste production, and biodiversity effects and circular economy activities, which must be measured, managed, and disclosed.
- Real-Time Emissions Monitoring and IoT Integration: The increased use of Internet of Things sensors and real-time monitoring solutions has altered the carbon management system with the retrospective annual accounting to the continuous emissions visibility that allows proactive management and optimization of operations. More sophisticated carbon management systems are now incorporated with IoT sensor networks of energy use, industrial processes, and sources of emissions reporting in real-time, building management systems that provide finer data about facility energy use and operations, industrial control systems that report process parameters influencing emissions, and mobile devices that can be used to gather field data of distributed sources of emissions. Industrial IoT studies show that with smart sensor networks to monitor energy and emissions, manufacturing plants can cut their energy use by 8-15% because of optimization in the operation process obtained by real-time visibility. Real-time monitoring offers a number of transformative features such as immediate visibility when the emissions become higher than expected to allow rapid investigation and correction, operational optimization of data to identify energy waste and process inefficiencies through continuous data analysis, automated alerts when the facilities or processes are not functioning within normal parameters, and granular attribution of understanding exactly which activities, equipment or processes are contributing to the emission. Contemporary systems add digital dashboards with real-time emissions data and trends, mobile apps that allow the field teams to check emissions data and field information, and automated reporting that generates daily, weekly, or monthly summary of emissions without compiling. It is currently being rapidly adopted in the energy and utilities industry with a 14.1% CAGR trend through 2035 due to real-time monitoring that will be necessary to manage the integration of variable renewable energy, dispatch optimization of the generation to reduce emissions, and give regulators and consumers a sense of transparency.
Category Wise Insights
By Component
Why Software Dominates the Market?
Software will be the biggest segment since it will take about 63% of the total market share in 2025. This pre-eminence corresponds to the main technological base needed to manage carbon within an enterprise, and advanced platforms are capable of data collection, calculation engines, analytics, reporting, and workflow automation, which cannot be emulated at an enterprise level by manual processes. Sixty-seven% of sustainability executives surveyed by the industry indicated using specific carbon management software as either essential or very important to meet corporate climate targets with an average enterprise implementation handling 50-500 sources of emissions and across different facilities and locations. Enterprise carbon management software is made up of several modules such as data collection and validation systems that accept a wide variety of input formats such as utility bills to IoT sensors, calculation engines that implement GHG Protocol methodologies and regional emission factors, reporting generators that produce disclosures across multiple frameworks at the same time, and analytics dashboards that provide insights into the trends of emissions, reduction opportunities, and target progress. These systems process difficult needs such as multi-entity consolidation of companies with subsidiaries in several nations, alignment of financial years and reporting periods to match different fiscal periods, and maintenance of audit trail that records all the data entry, calculations and its assumptions to be checked by the third party.
The services segment, which constitutes 37% market share has a consistent growth of 11.8% CAGR because organizations need the support of implementing, evaluating carbon footprint, strategy advisory, and managed services to continue operating the platform and reporting. Professional services assist a business to develop carbon accounting systems in accordance with GHG protocols, deploy and have systems linked to the organization hierarchy and information sources, take baseline measurements and data quality audits and educate sustainability staff on how to use the platform and best practices of carbon management. The managed services allow firms to delegate the daily carbon data processing, quality control, calculations and report generation to dedicated vendors, especially when the company does not have carbon accounting experience, or when it lacks sufficient resources to process the information during peak reporting times.
By Deployment Mode
Why Cloud-Based Solutions Are Growing Fastest?
Cloud-based deployment is the most rapidly expanding category with predicted CAGR of 13.8% between the years 2026 to 2035 due to high levels of accessibility, which helps sustainability groups worldwide to work together, automatic updating that ensures that the platform is current with the changing regulations and methods of calculating total cost of ownership, which gets removed, and security that is achieved by enterprise cloud systems. Enterprise carbon management providers on the cloud provide automatic elastic scaling to meet increasing data volumes as emissions measurement is increased, global data center presence that ensures regional performance and data residency compliance, ongoing platform improvements that deliver new features and enhancement with no disruptive upgrades, and pay-as-you-use models that match costs with organizational growth and usage of the platform. The research done on cloud computing has indicated that organizations with cloud computing carbon management platforms save up to 40-55% of total costs of the IT infrastructure over on-premise solutions and can deploy systems 70 times faster and incur 50% less maintenance overhead.
On-premise deployments are becoming less and less important, but still have some relevance in organizations that have steep data sovereignty need, in a regulated industry and government agencies that demand that data be kept within certain jurisdictions, highly-customized requirements that require extensive platform customization that is challenging in multi-tenant cloud services, and integration with existing on-premise systems such as manufacturing execution systems and industrial control platforms that are not available in cloud environments. Nevertheless, a mix of on-premise data collection and processing with cloud-based reporting and analytics, referred to as hybrid deployments, is getting more and more popular in the middle ground between control and accessibility. Such hybrid solutions allow keeping sensitive operational information in organizational infrastructure and use cloud computing to collaborate, report, and provide advanced analytics.
By Organization Size
Why Large Enterprises Lead Adoption?
The biggest segment comprises large enterprises which will take around 71 market share in 2025. This leadership represents the complicated organizational configurations, international activities, large volume of regulatory liabilities and huge carbon imprints that large companies are operating with that demand sophisticated enterprise grade platforms to handle exceptionally large scales and demanding multifaceted needs. The carbon footprint of large enterprises is usually hundreds of thousands of ton of CO2 equivalent up to millions of tons of CO2 equivalent of operations per year across dozens or hundreds of facilities, thousands of suppliers, vast transportation systems, and a wide variety of business units with different business characteristics. Enterprise sustainability research has found that Fortune 500 companies can operate on average carbon footprints of 2.8 million CO2e a year, and supply chain Scope 3 emissions can be 80-90% of total footprint, which involves collecting data about thousands of suppliers and partners.
Small and medium enterprises are growing more rapidly at 13.6% CAGR as cloud-based solutions are democratizing advanced carbon management tools formerly limited to large companies, regulation is spread more widely to SMEs via supply chain disclosure demands on large clients, and customer and partner demands are expanding to mandate that environmental performance be documented. Modern platforms have tiered pricing structures that enable powerful functions to be available at lower prices to small organizations, simplified interfaces that make them less complex to those teams that lack specific sustainability employees, and pre-built industry templates that can be implemented quicker. SMEs and small businesses According to small business sustainability surveys, there are customer or partner demands on emissions data in 2024 by 62% of SMEs (compared to 38% in 2022), and are thus quickly adopting sustainability despite the absence of formal sustainability department in many SMEs. Automated data collection is also especially beneficial to SMEs because it saves manual effort in resource-limited teams, instructs workspace users through guided processes of measuring and reporting and benchmarking to compare the performance with the industry peers.
By End-User Industry
Why Manufacturing Dominates Carbon Management Software Adoption?
Carbon management manufacturing strategies use advanced software features such as process level emissions tracking that assigns emissions to individual production lines, equipment, or product, energy management integration linking with the industrial internet of things sensors, building management systems, production correlation analytics linking emissions to production volumes, product types, process parameters, and supplier engagement portals that collect emissions data of material and component suppliers. Modern platforms allow manufacturers to streamline operations to be carbon efficient by providing real time tracking of energy intensive processes, predictive analytics of comparing how the process will emit based on production scheduling and scenario modelling of how a change in process, equipment or implementation of renewable energy would affect the process.
The energy and utilities sector is the quickest expanding segment that is projected to experience CAGR of 14.1% during the period 2026 to 2035 due to the transformation of the sector to renewable energy, the mandatory nature of emissions disclosure and reduction, and the increased demand of clean energy by consumers through transparency. The facilities deal with enormous carbon footprints of power production in fossil fuel power plants, distribution of natural gas and energy transmission systems, and at the same time the facilities monitor renewable energy production and carbon intensity measurements vital to customers reporting and regulatory compliance.
By Application
Why Carbon Accounting and Reporting Lead Market Applications?
Carbon management manufacturing strategies use advanced software features such as process level emissions tracking that assigns emissions to individual production lines, equipment, or product, energy management integration linking with the industrial internet of things sensors, building management systems, production correlation analytics linking emissions to production volumes, product types, process parameters, and supplier engagement portals that collect emissions data of material and component suppliers. Modern platforms allow manufacturers to streamline operations to be carbon efficient by providing real time tracking of energy intensive processes, predictive analytics of comparing how the process will emit based on production scheduling and scenario modeling of how a change in process, equipment or implementation of renewable energy would affect the process.
The energy and utilities sector is the quickest expanding segment that is projected to experience CAGR of 14.1% during the period 2026 to 2035 due to the transformation of the sector to renewable energy, the mandatory nature of emissions disclosure and reduction, and the increased demand of clean energy by consumers through transparency. The facilities deal with enormous carbon footprints of power production in fossil fuel power plants, distribution of natural gas and energy transmission systems, and at the same time the facilities monitor renewable energy production and carbon intensity measurements vital to customers reporting and regulatory compliance.
Report Scope
| Feature of the Report | Details |
| Market Size in 2026 | USD 14.08 billion |
| Projected Market Size in 2035 | USD 38.95 billion |
| Market Size in 2025 | USD 12.47 billion |
| CAGR Growth Rate | 12.9% CAGR |
| Base Year | 2025 |
| Forecast Period | 2026-2035 |
| Key Segment | By Component, Deployment Mode, Organization Size, Application, End-User Industry and Region |
| Report Coverage | Revenue Estimation and Forecast, Company Profile, Competitive Landscape, Growth Factors and Recent Trends |
| Regional Scope | North America, Europe, Asia Pacific, Middle East & Africa, and South & Central America |
| Buying Options | Request tailored purchasing options to fulfil your requirements for research. |
Regional Analysis
How Big is the Europe Market Size?
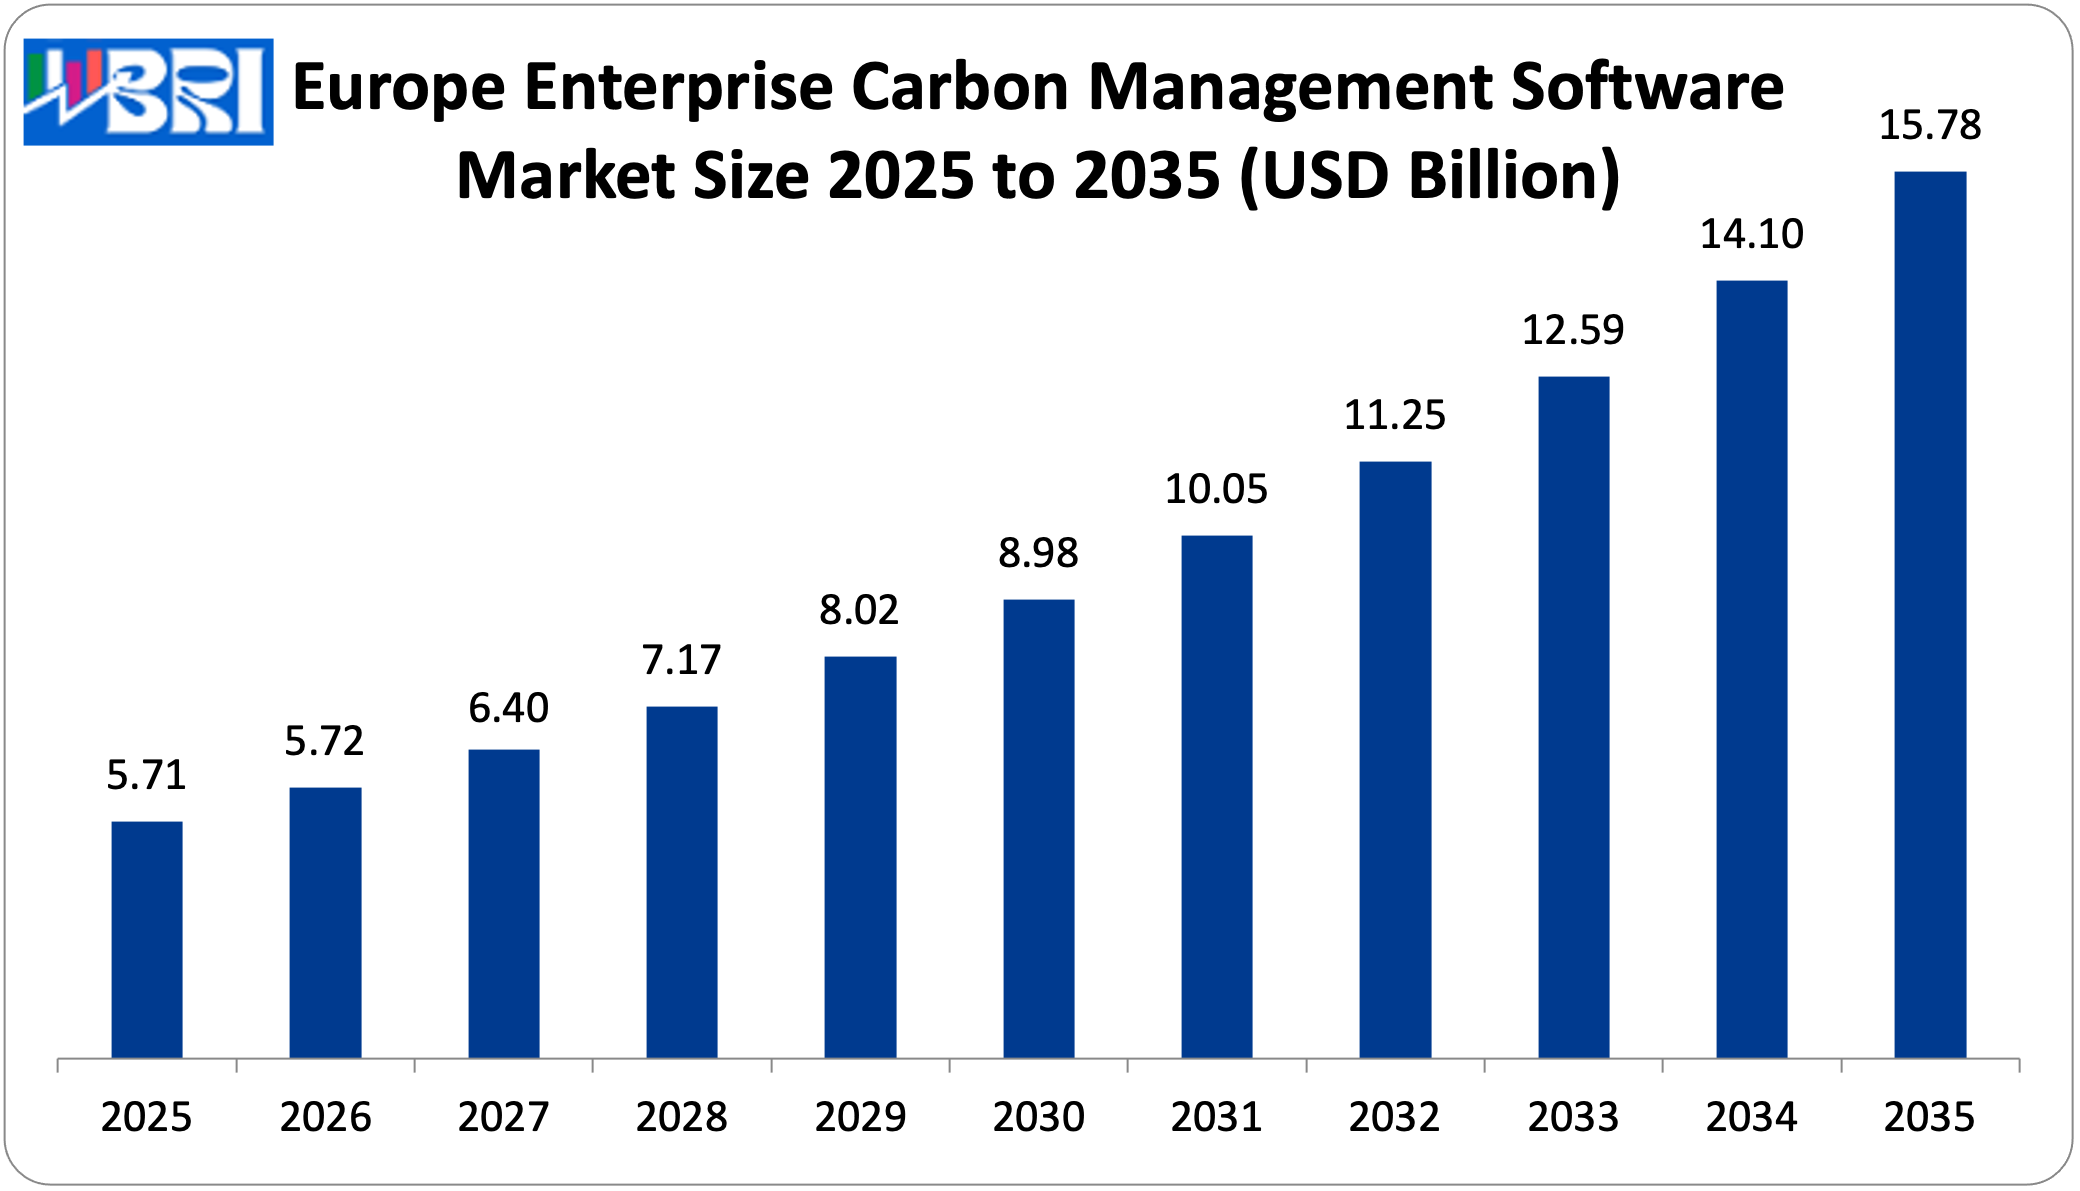
The Europe enterprise carbon management software market size is estimated at USD 5.11 billion in 2025 and is projected to reach approximately USD 15.78 billion by 2035, with a 12.0% CAGR from 2026 to 2035.
Why Did Europe Dominate the Market in 2025?
The largest European market is Germany driven by a highly developed manufacturing industry, such as automotive, chemicals, and industrial equipment with high emissions management needs, well-founded tradition of environmental management system (EMS) implementation including ISO 14001, national Climate Action Plan, and the frontline in industrial decarbonization initiatives such as the development of hydrogen economy.
Germany Market Trends
German firms are more focused on measuring and reporting their emissions in detail, 89% of the DAX-40 firms have released exhaustive sustainability reports that contain detailed climate information. Energiewende (energy transition), as the policy of the country, stimulates the emphasis on the efficiency of energy use and the introduction of renewable energy sources, which leads to the necessity of the use of the platforms which can model and trace the influence of the energy transformation programs. German sustainability studies claim that the rate of achievement of climate targets by manufacturing firms on advanced carbon management platforms is 15 times more rapid than that of basic measurement strategies.
Why is Asia Pacific Growing at the Fastest Rate?
The Asia Pacific area is the most rapidly expanding region with a forecasted CAGR of 15.2% between 2026 and 2035 due to the rapid growth of industrialization and manufacturing components that generate large carbon footprints that need to be managed, the growth of regulatory needs as major economies institute carbon pricing and carbon disclosure regulations, growing corporate sustainability obligations especially among export-oriented manufacturers, and large-scale investment in renewable energy sources and decarbonization technologies. Regional sustainability studies state that Asia Pacific contributes 53% of global greenhouse emissions but it contributed 31% of historical cumulative emissions, both of which provide tremendous decarbonization challenge and opportunity in carbon management solutions. China, Japan, South Korea, India and Australia are significant markets with different drivers and natures with similar direction of total carbon management.
China Market Trends
China boasts the largest and fastest growing Asia Pacific market, which is fuelled by the largest national carbon emissions trading system introduced in 2021 that covers the power industry with proposals to expand, mandatory rules on environmental information disclosure to listed companies and bond issuers, national target of becoming carbon neutral by 2060, and a large manufacturing sector with large supply chains that need to measure their emissions. The growing demand on the Chinese companies by the international customers who demand supplier emissions data and the leading European and North American brands that require decarbonization of their supply chains places further pressure on Chinese companies. Chinese corporate sustainability surveys indicate that listed companies liable to disclosure made more gains in carbon management software adoption by 156% in 2021-2024. The current policy environment favours carbon management in the country and the emphasis placed on the ecological civilization and the quality of the environment leads to the development of domestic software vendors that are focusing on localized platforms and solving China-specific regulations and integration with Chinese enterprise systems.
Why is North America Experiencing Strong Growth?
North America is growing well with a CAGR of 11.8 between 2026 and 2035 as large corporations are practicing mature sustainability reporting, SEC climate disclosure proposed regulations are creating regulatory catalyst, ESG investment community striving hard on climate transparency, and the technology industry is leading innovative solutions to carbon management systems. The U.S. has a large market and is estimated to have 7,000 publicly-traded companies which may be subject to a climate disclosure requirement by SEC, has a large and well-developed voluntary disclosure under CDP that currently has 1,800 U.S. participants and increasing state-level climate policies in California, New York and other jurisdictions that impose additional disclosure requirements.
U.S. Market Trends
The US market is a significant share of the global demand due to mass corporate emissions comprised of big cloud and software companies providing carbon management solutions, financial sector focus on climate risk with banks and asset managers seeking portfolio-level emissions data, and voluntary corporate commitment with majority of S&P 500 having climate targets necessitating carbon measurement and monitoring. In 2024, the survey of U.S. corporate sustainability initiatives and programs showed that 86% of Fortune 500 companies released sustainability reports, and 64% of those reports contained specific emissions information with reduction goals. The proposed SEC climate disclosure rule with its legal issues has led to faster corporate planning to mandatory reporting with companies developing carbon management infrastructure whether the final rule is adopted or not. The climate disclosure laws of California which compel large companies that run business in the state to report emissions and financial risks over climate, are an extra regulatory strain to thousands of companies.
Why is the LAMEA Region Experiencing Growth?
The LAMEA region is experiencing an upward trend in market development due to the rising corporate sustainability concern especially across multinationals in the region, new regulatory demands in larger economies, pressure in the supply chain as companies now have the need to report emission to their overseas customers and increased investment in renewable energy and climate related projects that need a baseline and tracking of emissions. The UAE and other Middle Eastern nations are ensuring the policies of the climate are introduced in accordance with the policies of economic diversification, and national net-zero declarations are motivating corporate responses. The European customers of Latin American firms are pressuring them to supply chain emissions information as mandated by CSRD Scope 3, which is compelling them to take up carbon management capabilities. A study of regional sustainability further indicated that Latin American firms in export-based industries such as agriculture, mining and manufacturing have improved the rate of carbon disclosure by 78% between 2020-2024 in accordance with the demands of the international customers.
Top Players in the Market and Their Offerings
- Salesforce Inc. (Salesforce Net Zero Cloud)
- SAP SE (SAP Cloud for Sustainable Enterprises)
- Microsoft Corporation (Microsoft Cloud for Sustainability)
- IBM Corporation (IBM Environmental Intelligence Suite)
- Workiva Inc.
- Wolters Kluwer (Enablon)
- Sphera Solutions Inc.
- Schneider Electric (EcoStruxure Resource Advisor)
- ENGIE Impact
- Persefoni AI Inc.
- Plan A
- Sweep
- Others
Market News – Key Developments
The market has undergone significant developments as industry participants seek to expand capabilities and enhance product portfolios.
- In February 2024: Microsoft declared significant enhancements of its Microsoft Cloud for Sustainability. The updates introduce AI-based tools that project the Scope 3 emissions and introduce automated processes to involve the suppliers. The features assist firms in quantifying their overall value-chain carbon print more quickly and reduce the necessity of collecting data manually.
- In April 2025: Salesforce has also grown its Net Zero Cloud by introducing a Supply Chain Emissions Management module. The module provides automated estimation using a spend-based, supplier score-carding as well as procurement integration. It satisfies the increasing need in Scope 3 measurement, particularly because the regulations are now disclosing a complete value-chain.
These strategic activities have allowed companies to strengthen market positions, expand product offerings, enhance technological capabilities, and capitalize on growth opportunities within the expanding market.
The Enterprise Carbon Management Software Market is segmented as follows:
By Component
- Software
- Carbon Accounting Software
- Emissions Tracking Software
- Reporting and Analytics Software
- Services
- Professional Services
- Managed Services
By Deployment Mode
- Cloud-based
- On-premise
- Hybrid
By Organization Size
- Small and Medium Enterprises (SMEs)
- Large Enterprises
By Application
- Carbon Accounting and Reporting
- Emissions Tracking and Monitoring
- Sustainability Reporting
- Supply Chain Carbon Management
- Carbon Offsetting and Trading
- Other Applications
By End-User Industry
- Manufacturing
- Energy and Utilities
- Transportation and Logistics
- Retail and Consumer Goods
- Information Technology
- Financial Services
- Other Industries
Regional Coverage:
North America
- U.S.
- Canada
- Mexico
- Rest of North America
Europe
- Germany
- France
- U.K.
- Russia
- Italy
- Spain
- Netherlands
- Rest of Europe
Asia Pacific
- China
- Japan
- India
- New Zealand
- Australia
- South Korea
- Taiwan
- Rest of Asia Pacific
The Middle East & Africa
- Saudi Arabia
- UAE
- Egypt
- Kuwait
- South Africa
- Rest of the Middle East & Africa
Latin America
- Brazil
- Argentina
- Rest of Latin America
[embedsocial_reviews id=”d4ae80cffae3d938f997111953699a733c8e6f99″]
Table of Contents
- Chapter 1. Preface
- 1.1 Report Description and Scope
- 1.2 Research scope
- 1.3 Research methodology
- 1.3.1 Market Research Type
- 1.3.2 Market research methodology
- Chapter 2. Executive Summary
- 2.1 Global Enterprise Carbon Management Software Market, (2026 – 2035) (USD Billion)
- 2.2 Global Enterprise Carbon Management Software Market : snapshot
- Chapter 3. Global Enterprise Carbon Management Software Market – Industry Analysis
- 3.1 Enterprise Carbon Management Software Market: Market Dynamics
- 3.2 Market Drivers
- 3.2.1 Stringent Regulatory Mandates and Compliance Requirements
- 3.2.2 Corporate Net-Zero Commitments and Climate Targets Driving Strategic Importance
- 3.3 Market Restraints
- 3.4 Market Opportunities
- 3.5 Market Challenges
- 3.6 Porter’s Five Forces Analysis
- 3.7 Market Attractiveness Analysis
- 3.7.1 Market attractiveness analysis By Component
- 3.7.2 Market attractiveness analysis By Deployment Mode
- 3.7.3 Market attractiveness analysis By Organization Size
- 3.7.4 Market attractiveness analysis By Application
- 3.7.5 Market attractiveness analysis By End-User Industry
- Chapter 4. Global Enterprise Carbon Management Software Market- Competitive Landscape
- 4.1 Company market share analysis
- 4.1.1 Global Enterprise Carbon Management Software Market: company market share, 2025
- 4.2 Strategic development
- 4.2.1 Acquisitions & mergers
- 4.2.2 New Product launches
- 4.2.3 Agreements, partnerships, cullaborations, and joint ventures
- 4.2.4 Research and development and Regional expansion
- 4.3 Price trend analysis
- 4.1 Company market share analysis
- Chapter 5. Global Enterprise Carbon Management Software Market – Component Analysis
- 5.1 Global Enterprise Carbon Management Software Market overview: By Component
- 5.1.1 Global Enterprise Carbon Management Software Market share, By Component, 2025 and 2035
- 5.2 Software
- 5.2.1 Global Enterprise Carbon Management Software Market by Software, 2026 – 2035 (USD Billion)
- 5.3 Carbon Accounting Software
- 5.3.1 Global Enterprise Carbon Management Software Market by Carbon Accounting Software, 2026 – 2035 (USD Billion)
- 5.4 Emissions Tracking Software
- 5.4.1 Global Enterprise Carbon Management Software Market by Emissions Tracking Software, 2026 – 2035 (USD Billion)
- 5.5 Reporting and Analytics Software
- 5.5.1 Global Enterprise Carbon Management Software Market by Reporting and Analytics Software, 2026 – 2035 (USD Billion)
- 5.6 Services
- 5.6.1 Global Enterprise Carbon Management Software Market by Services, 2026 – 2035 (USD Billion)
- 5.7 Professional Services
- 5.7.1 Global Enterprise Carbon Management Software Market by Professional Services, 2026 – 2035 (USD Billion)
- 5.8 Managed Services
- 5.8.1 Global Enterprise Carbon Management Software Market by Managed Services, 2026 – 2035 (USD Billion)
- 5.1 Global Enterprise Carbon Management Software Market overview: By Component
- Chapter 6. Global Enterprise Carbon Management Software Market – Deployment Mode Analysis
- 6.1 Global Enterprise Carbon Management Software Market overview: By Deployment Mode
- 6.1.1 Global Enterprise Carbon Management Software Market share, By Deployment Mode, 2025 and 2035
- 6.2 Cloud-based
- 6.2.1 Global Enterprise Carbon Management Software Market by Cloud-based, 2026 – 2035 (USD Billion)
- 6.3 On-premise
- 6.3.1 Global Enterprise Carbon Management Software Market by On-premise, 2026 – 2035 (USD Billion)
- 6.4 Hybrid
- 6.4.1 Global Enterprise Carbon Management Software Market by Hybrid, 2026 – 2035 (USD Billion)
- 6.1 Global Enterprise Carbon Management Software Market overview: By Deployment Mode
- Chapter 7. Global Enterprise Carbon Management Software Market – Organization Size Analysis
- 7.1 Global Enterprise Carbon Management Software Market overview: By Organization Size
- 7.1.1 Global Enterprise Carbon Management Software Market share, By Organization Size, 2025 and 2035
- 7.2 Small and Medium Enterprises (SMEs)
- 7.2.1 Global Enterprise Carbon Management Software Market by Small and Medium Enterprises (SMEs), 2026 – 2035 (USD Billion)
- 7.3 Large Enterprises
- 7.3.1 Global Enterprise Carbon Management Software Market by Large Enterprises, 2026 – 2035 (USD Billion)
- 7.1 Global Enterprise Carbon Management Software Market overview: By Organization Size
- Chapter 8. Global Enterprise Carbon Management Software Market – Application Analysis
- 8.1 Global Enterprise Carbon Management Software Market overview: By Application
- 8.1.1 Global Enterprise Carbon Management Software Market share, By Application, 2025 and 2035
- 8.2 Carbon Accounting and Reporting
- 8.2.1 Global Enterprise Carbon Management Software Market by Carbon Accounting and Reporting, 2026 – 2035 (USD Billion)
- 8.3 Emissions Tracking and Monitoring
- 8.3.1 Global Enterprise Carbon Management Software Market by Emissions Tracking and Monitoring, 2026 – 2035 (USD Billion)
- 8.4 Sustainability Reporting
- 8.4.1 Global Enterprise Carbon Management Software Market by Sustainability Reporting, 2026 – 2035 (USD Billion)
- 8.5 Supply Chain Carbon Management
- 8.5.1 Global Enterprise Carbon Management Software Market by Supply Chain Carbon Management, 2026 – 2035 (USD Billion)
- 8.6 Carbon Offsetting and Trading
- 8.6.1 Global Enterprise Carbon Management Software Market by Carbon Offsetting and Trading, 2026 – 2035 (USD Billion)
- 8.7 Other Applications
- 8.7.1 Global Enterprise Carbon Management Software Market by Other Applications, 2026 – 2035 (USD Billion)
- 8.1 Global Enterprise Carbon Management Software Market overview: By Application
- Chapter 9. Global Enterprise Carbon Management Software Market – End-User Industry Analysis
- 9.1 Global Enterprise Carbon Management Software Market overview: By End-User Industry
- 9.1.1 Global Enterprise Carbon Management Software Market share, By End-User Industry, 2025 and 2035
- 9.2 Manufacturing
- 9.2.1 Global Enterprise Carbon Management Software Market by Manufacturing, 2026 – 2035 (USD Billion)
- 9.3 Energy and Utilities
- 9.3.1 Global Enterprise Carbon Management Software Market by Energy and Utilities, 2026 – 2035 (USD Billion)
- 9.4 Transportation and Logistics
- 9.4.1 Global Enterprise Carbon Management Software Market by Transportation and Logistics, 2026 – 2035 (USD Billion)
- 9.5 Retail and Consumer Goods
- 9.5.1 Global Enterprise Carbon Management Software Market by Retail and Consumer Goods, 2026 – 2035 (USD Billion)
- 9.6 Information Technology
- 9.6.1 Global Enterprise Carbon Management Software Market by Information Technology, 2026 – 2035 (USD Billion)
- 9.7 Financial Services
- 9.7.1 Global Enterprise Carbon Management Software Market by Financial Services, 2026 – 2035 (USD Billion)
- 9.8 Other Industries
- 9.8.1 Global Enterprise Carbon Management Software Market by Other Industries, 2026 – 2035 (USD Billion)
- 9.1 Global Enterprise Carbon Management Software Market overview: By End-User Industry
- Chapter 10. Enterprise Carbon Management Software Market – Regional Analysis
- 10.1 Global Enterprise Carbon Management Software Market Regional Overview
- 10.2 Global Enterprise Carbon Management Software Market Share, by Region, 2025 & 2035 (USD Billion)
- 10.3. North America
- 10.3.1 North America Enterprise Carbon Management Software Market, 2026 – 2035 (USD Billion)
- 10.3.1.1 North America Enterprise Carbon Management Software Market, by Country, 2026 – 2035 (USD Billion)
- 10.3.1 North America Enterprise Carbon Management Software Market, 2026 – 2035 (USD Billion)
- 10.4 North America Enterprise Carbon Management Software Market, by Component, 2026 – 2035
- 10.4.1 North America Enterprise Carbon Management Software Market, by Component, 2026 – 2035 (USD Billion)
- 10.5 North America Enterprise Carbon Management Software Market, by Deployment Mode, 2026 – 2035
- 10.5.1 North America Enterprise Carbon Management Software Market, by Deployment Mode, 2026 – 2035 (USD Billion)
- 10.6 North America Enterprise Carbon Management Software Market, by Organization Size, 2026 – 2035
- 10.6.1 North America Enterprise Carbon Management Software Market, by Organization Size, 2026 – 2035 (USD Billion)
- 10.7 North America Enterprise Carbon Management Software Market, by Application, 2026 – 2035
- 10.7.1 North America Enterprise Carbon Management Software Market, by Application, 2026 – 2035 (USD Billion)
- 10.8 North America Enterprise Carbon Management Software Market, by End-User Industry, 2026 – 2035
- 10.8.1 North America Enterprise Carbon Management Software Market, by End-User Industry, 2026 – 2035 (USD Billion)
- 10.9. Europe
- 10.9.1 Europe Enterprise Carbon Management Software Market, 2026 – 2035 (USD Billion)
- 10.9.1.1 Europe Enterprise Carbon Management Software Market, by Country, 2026 – 2035 (USD Billion)
- 10.9.1 Europe Enterprise Carbon Management Software Market, 2026 – 2035 (USD Billion)
- 10.10 Europe Enterprise Carbon Management Software Market, by Component, 2026 – 2035
- 10.10.1 Europe Enterprise Carbon Management Software Market, by Component, 2026 – 2035 (USD Billion)
- 10.11 Europe Enterprise Carbon Management Software Market, by Deployment Mode, 2026 – 2035
- 10.11.1 Europe Enterprise Carbon Management Software Market, by Deployment Mode, 2026 – 2035 (USD Billion)
- 10.12 Europe Enterprise Carbon Management Software Market, by Organization Size, 2026 – 2035
- 10.12.1 Europe Enterprise Carbon Management Software Market, by Organization Size, 2026 – 2035 (USD Billion)
- 10.13 Europe Enterprise Carbon Management Software Market, by Application, 2026 – 2035
- 10.13.1 Europe Enterprise Carbon Management Software Market, by Application, 2026 – 2035 (USD Billion)
- 10.14 Europe Enterprise Carbon Management Software Market, by End-User Industry, 2026 – 2035
- 10.14.1 Europe Enterprise Carbon Management Software Market, by End-User Industry, 2026 – 2035 (USD Billion)
- 10.15. Asia Pacific
- 10.15.1 Asia Pacific Enterprise Carbon Management Software Market, 2026 – 2035 (USD Billion)
- 10.15.1.1 Asia Pacific Enterprise Carbon Management Software Market, by Country, 2026 – 2035 (USD Billion)
- 10.15.1 Asia Pacific Enterprise Carbon Management Software Market, 2026 – 2035 (USD Billion)
- 10.16 Asia Pacific Enterprise Carbon Management Software Market, by Component, 2026 – 2035
- 10.16.1 Asia Pacific Enterprise Carbon Management Software Market, by Component, 2026 – 2035 (USD Billion)
- 10.17 Asia Pacific Enterprise Carbon Management Software Market, by Deployment Mode, 2026 – 2035
- 10.17.1 Asia Pacific Enterprise Carbon Management Software Market, by Deployment Mode, 2026 – 2035 (USD Billion)
- 10.18 Asia Pacific Enterprise Carbon Management Software Market, by Organization Size, 2026 – 2035
- 10.18.1 Asia Pacific Enterprise Carbon Management Software Market, by Organization Size, 2026 – 2035 (USD Billion)
- 10.19 Asia Pacific Enterprise Carbon Management Software Market, by Application, 2026 – 2035
- 10.19.1 Asia Pacific Enterprise Carbon Management Software Market, by Application, 2026 – 2035 (USD Billion)
- 10.20 Asia Pacific Enterprise Carbon Management Software Market, by End-User Industry, 2026 – 2035
- 10.20.1 Asia Pacific Enterprise Carbon Management Software Market, by End-User Industry, 2026 – 2035 (USD Billion)
- 10.21. Latin America
- 10.21.1 Latin America Enterprise Carbon Management Software Market, 2026 – 2035 (USD Billion)
- 10.21.1.1 Latin America Enterprise Carbon Management Software Market, by Country, 2026 – 2035 (USD Billion)
- 10.21.1 Latin America Enterprise Carbon Management Software Market, 2026 – 2035 (USD Billion)
- 10.22 Latin America Enterprise Carbon Management Software Market, by Component, 2026 – 2035
- 10.22.1 Latin America Enterprise Carbon Management Software Market, by Component, 2026 – 2035 (USD Billion)
- 10.23 Latin America Enterprise Carbon Management Software Market, by Deployment Mode, 2026 – 2035
- 10.23.1 Latin America Enterprise Carbon Management Software Market, by Deployment Mode, 2026 – 2035 (USD Billion)
- 10.24 Latin America Enterprise Carbon Management Software Market, by Organization Size, 2026 – 2035
- 10.24.1 Latin America Enterprise Carbon Management Software Market, by Organization Size, 2026 – 2035 (USD Billion)
- 10.25 Latin America Enterprise Carbon Management Software Market, by Application, 2026 – 2035
- 10.25.1 Latin America Enterprise Carbon Management Software Market, by Application, 2026 – 2035 (USD Billion)
- 10.26 Latin America Enterprise Carbon Management Software Market, by End-User Industry, 2026 – 2035
- 10.26.1 Latin America Enterprise Carbon Management Software Market, by End-User Industry, 2026 – 2035 (USD Billion)
- 10.27. The Middle-East and Africa
- 10.27.1 The Middle-East and Africa Enterprise Carbon Management Software Market, 2026 – 2035 (USD Billion)
- 10.27.1.1 The Middle-East and Africa Enterprise Carbon Management Software Market, by Country, 2026 – 2035 (USD Billion)
- 10.27.1 The Middle-East and Africa Enterprise Carbon Management Software Market, 2026 – 2035 (USD Billion)
- 10.28 The Middle-East and Africa Enterprise Carbon Management Software Market, by Component, 2026 – 2035
- 10.28.1 The Middle-East and Africa Enterprise Carbon Management Software Market, by Component, 2026 – 2035 (USD Billion)
- 10.29 The Middle-East and Africa Enterprise Carbon Management Software Market, by Deployment Mode, 2026 – 2035
- 10.29.1 The Middle-East and Africa Enterprise Carbon Management Software Market, by Deployment Mode, 2026 – 2035 (USD Billion)
- 10.30 The Middle-East and Africa Enterprise Carbon Management Software Market, by Organization Size, 2026 – 2035
- 10.30.1 The Middle-East and Africa Enterprise Carbon Management Software Market, by Organization Size, 2026 – 2035 (USD Billion)
- 10.31 The Middle-East and Africa Enterprise Carbon Management Software Market, by Application, 2026 – 2035
- 10.31.1 The Middle-East and Africa Enterprise Carbon Management Software Market, by Application, 2026 – 2035 (USD Billion)
- 10.32 The Middle-East and Africa Enterprise Carbon Management Software Market, by End-User Industry, 2026 – 2035
- 10.32.1 The Middle-East and Africa Enterprise Carbon Management Software Market, by End-User Industry, 2026 – 2035 (USD Billion)
- Chapter 11. Company Profiles
- 11.1 Salesforce Inc. (Salesforce Net Zero Cloud)
- 11.1.1 Overview
- 11.1.2 Financials
- 11.1.3 Product Portfolio
- 11.1.4 Business Strategy
- 11.1.5 Recent Developments
- 11.2 SAP SE (SAP Cloud for Sustainable Enterprises)
- 11.2.1 Overview
- 11.2.2 Financials
- 11.2.3 Product Portfolio
- 11.2.4 Business Strategy
- 11.2.5 Recent Developments
- 11.3 Microsoft Corporation (Microsoft Cloud for Sustainability)
- 11.3.1 Overview
- 11.3.2 Financials
- 11.3.3 Product Portfolio
- 11.3.4 Business Strategy
- 11.3.5 Recent Developments
- 11.4 IBM Corporation (IBM Environmental Intelligence Suite)
- 11.4.1 Overview
- 11.4.2 Financials
- 11.4.3 Product Portfolio
- 11.4.4 Business Strategy
- 11.4.5 Recent Developments
- 11.5 Workiva Inc.
- 11.5.1 Overview
- 11.5.2 Financials
- 11.5.3 Product Portfolio
- 11.5.4 Business Strategy
- 11.5.5 Recent Developments
- 11.6 Wolters Kluwer (Enablon)
- 11.6.1 Overview
- 11.6.2 Financials
- 11.6.3 Product Portfolio
- 11.6.4 Business Strategy
- 11.6.5 Recent Developments
- 11.7 Sphera Solutions Inc.
- 11.7.1 Overview
- 11.7.2 Financials
- 11.7.3 Product Portfolio
- 11.7.4 Business Strategy
- 11.7.5 Recent Developments
- 11.8 Schneider Electric (EcoStruxure Resource Advisor)
- 11.8.1 Overview
- 11.8.2 Financials
- 11.8.3 Product Portfolio
- 11.8.4 Business Strategy
- 11.8.5 Recent Developments
- 11.9 ENGIE Impact
- 11.9.1 Overview
- 11.9.2 Financials
- 11.9.3 Product Portfolio
- 11.9.4 Business Strategy
- 11.9.5 Recent Developments
- 11.10 Persefoni AI Inc.
- 11.10.1 Overview
- 11.10.2 Financials
- 11.10.3 Product Portfolio
- 11.10.4 Business Strategy
- 11.10.5 Recent Developments
- 11.11 Plan A
- 11.11.1 Overview
- 11.11.2 Financials
- 11.11.3 Product Portfolio
- 11.11.4 Business Strategy
- 11.11.5 Recent Developments
- 11.12 Sweep
- 11.12.1 Overview
- 11.12.2 Financials
- 11.12.3 Product Portfolio
- 11.12.4 Business Strategy
- 11.12.5 Recent Developments
- 11.13 Others.
- 11.13.1 Overview
- 11.13.2 Financials
- 11.13.3 Product Portfolio
- 11.13.4 Business Strategy
- 11.13.5 Recent Developments
- 11.1 Salesforce Inc. (Salesforce Net Zero Cloud)
List Of Figures
Figures No 1 to 45
List Of Tables
Tables No 1 to 127
Reports FAQs
The key players in the market are Salesforce Inc. (Salesforce Net Zero Cloud), SAP SE (SAP Cloud for Sustainable Enterprises), Microsoft Corporation (Microsoft Cloud for Sustainability), IBM Corporation (IBM Environmental Intelligence Suite), Workiva Inc., Wolters Kluwer (Enablon), Sphera Solutions Inc., Schneider Electric (EcoStruxure Resource Advisor), ENGIE Impact, Persefoni AI Inc., Plan A, Sweep, Others.
Government regulation: Government regulation has a significant impact on the market, with mandatory climate disclosure rules such as EU CSRD to 50,000 companies, proposed SEC rules to 7,000+ publicly-traded companies, and UK TCFD-compliant requirements to premium-listed companies, as well as with carbon pricing schemes and carbon taxes, offset requirements to give economic incentives to properly measure, sector-specific regulations, such as energy, manufacturing, transportation, and other industries, which put an upper limit on emissions and a reporting requirement, and public procurement policy viewing These regulations generate compliance requirements that demand effective software and competitive forces in which first movers have the benefit in risk management, operational competence, and stakeholder relations. The increasing trends in regulatory expansion such as Scope 3 reporting requirements, product carbon labelling requirements, and climate-related financial risk assessment requirement impose increasing sophistication demands in support of specialized platforms as opposed to manual methods.
Enterprise carbon management software is a type of variable investments, where the cost varies with organization size, complexity in operations and features demanded. On average, cloud-based SaaS services charge USD 10,000-30,000, USD 50,000-150,000, and USD 200,000-1,000,000+ annually, based on the size of business with simple operation, multiple facilities, and complex supply chains plus emission sources, respectively. Nonetheless, there are reasons to support such investments such as regulatory compliance which prevents large amounts of fines due to non-compliance with the EU CSRD which amount to 5% of revenue, operational efficiency that finds 8-15% of energy cost reduction opportunities through the in-depth analysis of emissions, risk-reduction which addresses the issue of climate-related financial risks which tend to become more and more significant to the business values, competitive advantage which is a result of sustainability leadership that differentiates the companies in terms of customer and investor relations, and automation benefits that save Implementation, baseline measurement and strategy development are all professional services that generally increase software expenses 50-150% of first year, but reduce considerably in later years.
According to the current analysis, it is estimated that by 2035, the market will reach about USD 38.95 billion with a strong growth rate of up to 12.9%, and this is due to the mandatory expansion of climate disclosures in the jurisdiction, the corporate net-zero commitment that will need multi-decade measurement and tracking of carbon footprint, the introduction of AI and IoT that will enable real-time monitoring and predictive analytics, the integration of ESG platform using carbon in combination with other sustainability indicators, and the method used in product.
Europe is projected to have the largest share of revenue, with a share of about 41% of the global market share as the Corporate Sustainability Reporting Directive in the European Union is the most comprehensive mandate in the world, with target of 55% reduction of emissions by 2030 and competence of reserving carbon emissions by 2050, and mature sustainability reporting culture with decades long history of corporate ESG disclosure, well-established Emissions Trading System that would create incentives of carbon pricing, aggressive enforcement of regulations and penalties of failure to comply.
Asia-Pacific Region is growing at the fastest rate with an estimated 15.2% in the forecast between the years 2026 and 2035 due to the rapid industrialization and manufacturing growth which makes huge carbon footprint, the establishment of a national emissions trading system and carbon neutrality commitment by 2060 in China, Business Responsibility and Sustainability Reporting requirements in India, covering the top 1,000 listed companies, the growing pressure by international customers demanding supply chain emissions data, along with the huge renewable energy investments which mandates baseline measurement.
Global Enterprise Carbon Management Software Market is expected to realize a significant growth as the regulatory requirement with EU CSRD impacting 50,000 companies and proposed SEC regulations impacting 7,000+ U.S. publicly traded companies, 929 of world 2,000 largest companies with net-zero commitments covering USD 24.8 trillion of revenues, investor pressure with sustainable investment assets totaling USD 30.3 trillion and 36% of professionally managed assets, and increasing disclosure requirements on the supply chain with 11%.
Proceed To Buy